Zoom on only one x-axis when chart has 2 x axis (top and bottom)

Hello Pierre,

As discussed in today’s call.
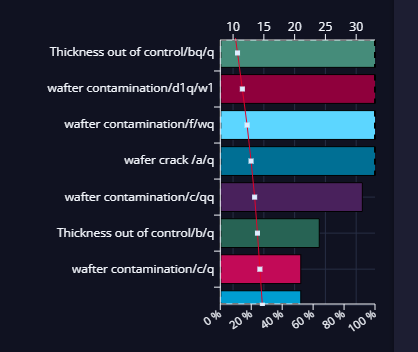
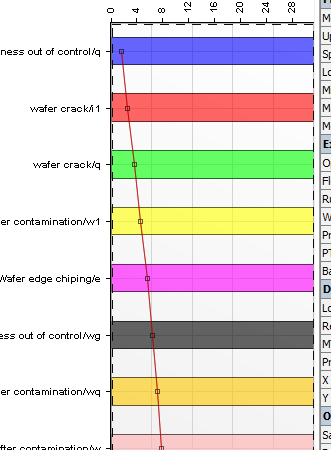
In pareto chart, there are 2 axis one for bar and other for cumulative line. we would like to apply x axis zoom only for bar axis and keep cumulative x axis as is.
Please let us know how to do that

How to Zoom only on pareto bar and not cumulative line axis. See Top axis and Bottom axis
image

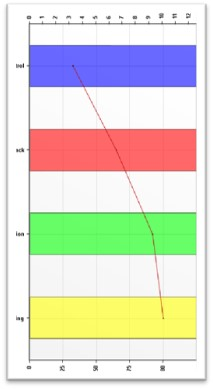
Referring here ParetoSample from vertical project:

fun VizContainer.pareto(data: List<DefectCount>, paretoData: List<Double>) =
    chart(data) {

        config {
            padding = Padding(10.0, 23.0, 10.0, 10.0)
            performanceMode = true
            events {
                highlightMode = HighlightMode.Single
                zoomMode = ZoomMode.X
            }
        }

        val type = discrete({ domain.type }) {
            formatter = { this.label }
        }

        val count = quantitative({ domain.count.toDouble() }) {
            name = "Defect Count"
            formatter = { this?.toInt().toString() }
        }

        val cumul = quantitative( { paretoData[indexInData] } ) {
            formatter = { "${this?.toInt()}%" }
            name = "Cumulative percentage"
        }

        bar(count, type) {
            x {
                min = .0
                start = .0
            }
            stacking = Stacking.Standard
            strokeColor = discrete({ config.mark.strokeColors[3 - indexInData] })
            strokeColorHighlight = discrete({ config.mark.strokeColorsHighlight[3 - indexInData] })
            fill = discrete({ config.mark.fills[3 - indexInData] })
            fillHighlight = discrete({ config.mark.fillsHighlight[3 - indexInData] })
        }

        line(cumul, type) {
            x {
                min = .0
                start = .0
                layoutPosition = LayoutPosition.Top
                strokeColor = Colors.Web.darkred
                fontColor = Colors.Web.darkred
                tickStroke = Colors.Web.darkred
            }
            strokeColor = constant(Colors.Web.darkred)
            strokeColorHighlight = constant(Colors.Web.darkred)
            symbol = constant(Symbols.Square)
            size = constant(15.0)
        }
    }

Many Thanks!

Just add an experimental feature, you can now “fix” an axis to avoid making it zoomable/pannable.

This is available (as experimental) in customer version 1.0.14 of Charts-kt.
Please try, to confirm the expected behavior.

line(xDim, yDim) {
    y {
        start = .0
        end = 1.0
        fixed = true
    }
}

Hello Pierre,

Thanks for the reply.
We tried this solution by adding fixed=true to cumulative line that is working…

Enabled zoom on XY axis on pareto chart, Following is the result after zoom

image

But, after zoom, start of x-axis is not zero(0) for bar chart. Can you tell me how to keep it 0 even after zoom…

Zoom event controller:

fun eventControllerParetoHistogram(chartType: ChartType, instanceId: String): EventContext<ParetoHistogramData>.() -> Unit = {
  when (eventType) {
    EventType.Drag -> {
      when {
        noKey() -> {  // draw rectangle selection for zoom
          chart.displaySelectionZoom(zoomZone)
        }
        else -> chart.defaultChartActionOnUserEvent(this)
      }
    }
    EventType.DragEnd -> {  // for zooming
      when {
        // Click + drag without modifier = zoom on X
        noKey() -> {
          chart.hideSelection()
          chart.pushEvent(ZoomEvent(zoomAction))
        }
        else -> chart.defaultChartActionOnUserEvent(this)
      }
      changeMouseCursorToDefaultIcon(chartType.name)
    }
    else -> {
      chart.defaultChartActionOnUserEvent(this)
    }
  }
}

We want something like below, where even after zoom, x-axis starts with 0

image

I see, I’ll try to find some time this weekend, I think I’ll add “fixedStart” and “fixedEnd” instead of “start/end/fixed” so in your example, you’ll have this pseudo-code:

chart {
    bar {
        y {
            fixedStart = .0
        }
    }
    line {
        y {
            fixedStart = .0
            fixedEnd = 100.0
        }
    }
}

I’ll keep you informed.

The “zoom” is an object that stores the “visual zoom” and is shared throughout the application (shared between axes), even if you have multiple marks, multiple axes, you have one zoom.

When an event requests a zoom change, it is passed to the axes and they “validate” or “update” the zoom. For example, if an axis has an absolute minimum, it changes the zoom to display no further than this value…
By doing so, we are sure to keep the axes synchronized AND respect the axes constraints.


Considering this, if you have an axis (the cumulative right axis in our case) that is completely “fixed” it would block any zoom for all other axes.
That’s why we need to have different properties:

  • fixedMin or fixedMax (Double or Instant in case of a Temporal axis) are fixed values and the axis will always keep that value as min/max (even in case of panning !) and it will “constrain” the zoom (or pan) and return a new zoom when asked for.
  • fixed (Boolean) if an axis is "fixed, " it simply cannot display any zoom or pan, it simply “skips” any zoom or pan applied and does not modify the overall zoom of the application.

Each property is exclusive (you cannot have fixedMax and fixedMin, it will raise an error, use fixed in this case).


This is available (as experimental) in customer version 1.0.15 of Charts-kt.
The new Pareto sample:

chart {
    bar {
        y {
            fixedMin = .0
        }
    }
    line {
        y {
            fixed = true
        }
    }
}

I tried to use 1.0.15 but getting following error:

Could not determine the dependencies of task ‘:space-web-charts:jsPackageJson’.

Could not resolve all dependencies for configuration ‘:space-web-charts:jsNpm’.
Could not resolve io.data2viz.charts:core:1.0.15.

Could you please check…

Can you check again on your side?

We have no difference between the 1.0.14 and the 1.0.15.

CleanShot 2025-02-03 at 11.03.28@2x
CleanShot 2025-02-03 at 11.04.04@2x

Pierre mentioned: " Each property is exclusive (you cannot have fixedMax and fixedMin, it will raise an error, use fixed in this case).

This is available (as experimental) in customer version 1.0.15 of Charts-kt."

I tried to use 1.0.15 again but still getting same error:
Could not resolve all dependencies for configuration ‘:space-web-charts:jsNpm’.

Could not resolve io.data2viz.charts:core:1.0.15.
Required by:
project :space-web-charts
No matching variant of io.data2viz.charts:core:1.0.15 was found. The consumer was configured to find a library for use during ‘kotlin-runtime’, preferably optimized for non-jvm, as well as attribute ‘org.jetbrains.kotlin.platform.type’ with value ‘js’, attribute ‘org.jetbrains.kotlin.js.compiler’ with value ‘ir’ but:
- Variant ‘jfxApiElements-published’ capability io.data2viz.charts:core:1.0.15 declares a library:
- Incompatible because this component declares a component for use during compile-time, as well as a

It seems like I had an issue deploying this version, please retry with 1.0.15, I just republished everything.

Thanks for reply.
But, I am getting same error:
Could not resolve all dependencies for configuration ‘:space-web-charts:jsNpm’.

Could not resolve io.data2viz.charts:core:1.0.15.
Required by:
project :space-web-charts
No matching variant of io.data2viz.charts:core:1.0.15 was found. The consumer was configured to find a library for use during ‘kotlin-runtime’, preferably optimized for non-jvm, as well as attribute ‘org.jetbrains.kotlin.platform.type’ with value ‘js’, attribute ‘org.jetbrains.kotlin.js.compiler’ with value ‘ir’ but:
- Variant ‘jfxApiElements-published’ capability io.data2viz.charts:core:1.0.15 declares a library:
- Incompatible because this component declares a component for use during compile-time, as well as attribute ‘org.jetbrains.kotlin.platform.type’ with value ‘jvm’ and the consumer needed a component for use during ‘kotlin-runtime’, as well as attribute ‘org.jetbrains.kotlin.platform.type’ with value ‘js’
- Other compatible attributes:
- Doesn’t say anything about its target Java environment (preferred optimized for non-jvm)
- Doesn’t say anything about org.jetbrains.kotlin.js.compiler (required ‘ir’)
- Variant ‘jfxRuntimeElements-published’ capability io.data2viz.charts:core:1.0.15 declares a library for use during runtime:
- Incompatible because this component declares a component, as well as attribute ‘org.jetbrains.kotlin.platform.type’ with value ‘jvm’ and the consumer needed a component, as well as attribute ‘org.jetbrains.kotlin.platform.type’ with value ‘js’
- Other compatible attributes:
- Doesn’t say anything about its target Java environment (preferred optimized for non-jvm)
- Doesn’t say anything about org.jetbrains.kotlin.js.compiler (required ‘ir’)
- Variant ‘metadataApiElements’ capability io.data2viz.charts:core:1.0.15 declares a library:
- Incompatible because this component declares a component for use during ‘kotlin-metadata’, as well as attribute ‘org.jetbrains.kotlin.platform.type’ with value ‘common’ and the consumer needed a component for use during ‘kotlin-runtime’, as well as attribute ‘org.jetbrains.kotlin.platform.type’ with value ‘js’
- Other compatible attributes:
- Doesn’t say anything about its target Java environment (preferred optimized for non-jvm)
- Doesn’t say anything about org.jetbrains.kotlin.js.compiler (required ‘ir’)

Also, regarding chart KT source code handover, I have sent you mail last week as an reminder .
Could you please let us know when we can start transition as it is important to us now.

Many Thanks!

Very intriguing… I will try to find time today to deploy a new version again…

EDIT: @bhargava please try with version 1.0.15.1

1 Like

I can download now 1.0.15.1.
I will try the fix.

Keep me updated :+1:


Concerning the source I’m preparing a clean archive and a how-to build the project, I’ll post it in the “camline” private section of the forum very soon.

1 Like

It works now, thanks!