How to override the css in chart/canvas

Context:
For the common x-axis we create a labelizer chart and place it to the end.
As the number of chart increase a vertical scroll bar is created and as an effect of this the common x-axis scrolls out of the view. Hence we decided to position the common x-axis chart to the bottom of the browser/chart-container.

And to position the common x-axis chart to the bottom of the chart so that the other charts scroll under it, I am trying to use the css properties position: sticky and botton:0px.

But unfortunately these css properties are getting ignored because the chart get created with its own position property. like below
image

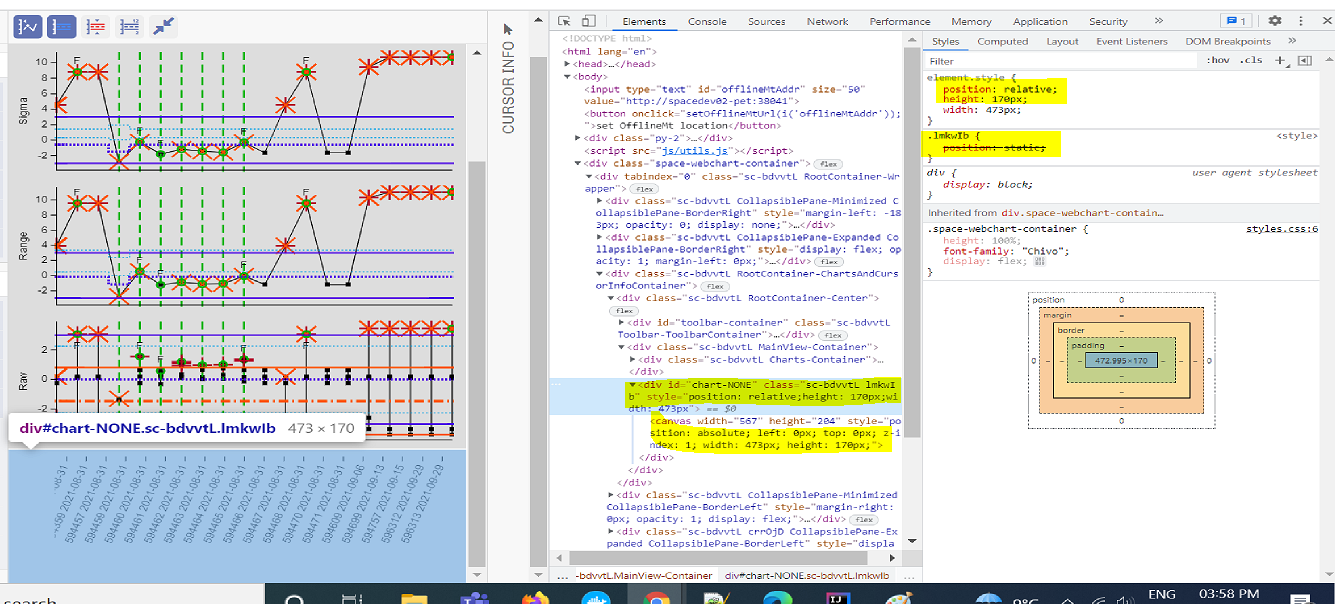
So how to change the css of the chart/canvas?.

Note: each chart/canvas is created under a parent div(highlighted with yellow in the screenshot).
So in order to make the common x-axis chart sticky we have to change the position property as below,

Data2viz uses CSS for two reasons:

  1. To be able to manage the pixel density of the screen.
  2. To allow the superposition of two canvas (one in the background, and one in the foreground) in the case of optimization. The background canvas is not redrawn during mouse-over, selection, …

Did you try to wrap your chart in an intermediate div that would hold the CSS position properties?

Yes, yesterday I had tried to wrap the chart in a div but then the chart were overflowing the common x-axis. But I did not realizes this was because of the z-index=1 that comes assigned after chart creation.

Now I got it working. I added z-index=2 to the wrapper div like below and it works,

styledDiv { // wrapper div
    css {
      position = Position.sticky
      bottom = 0.px
      zIndex = 2
    }
    styledDiv {
      ref = chartDiv
      attrs.id = "chart-${props.chartType.name}"
    }
  }

Thank you.

2 Likes