How can I set the limits of an axis

How can I set insets or margins to a chart?

I guess, by default the Y scale range is calculated from the data.
My problem is that my the lower spec limit line is not fully visible because it is drawn at the exact start of the axis.

image

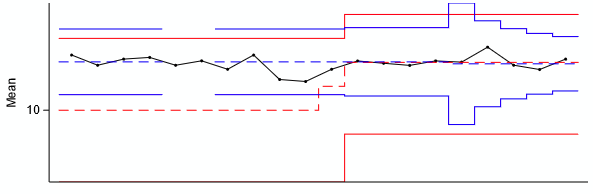
If the chart would have 2 pixel inset, it would be much better.

This is not “margins” or “insets”, what you want to do is to manually set a start/end to your axis, check this example on how to set an “end” to a Y-axis: https://play.data2viz.io/sketches/pYBQoL/edit/

These values will override the default computed limits of the chart, and display the range you have selected yourself.

Note: you can also use min/max, this is used to “limit” the axis to certain values, so you cannot move or zoom the chart over these values. Check the Axis reference for a complete detail.

1 Like