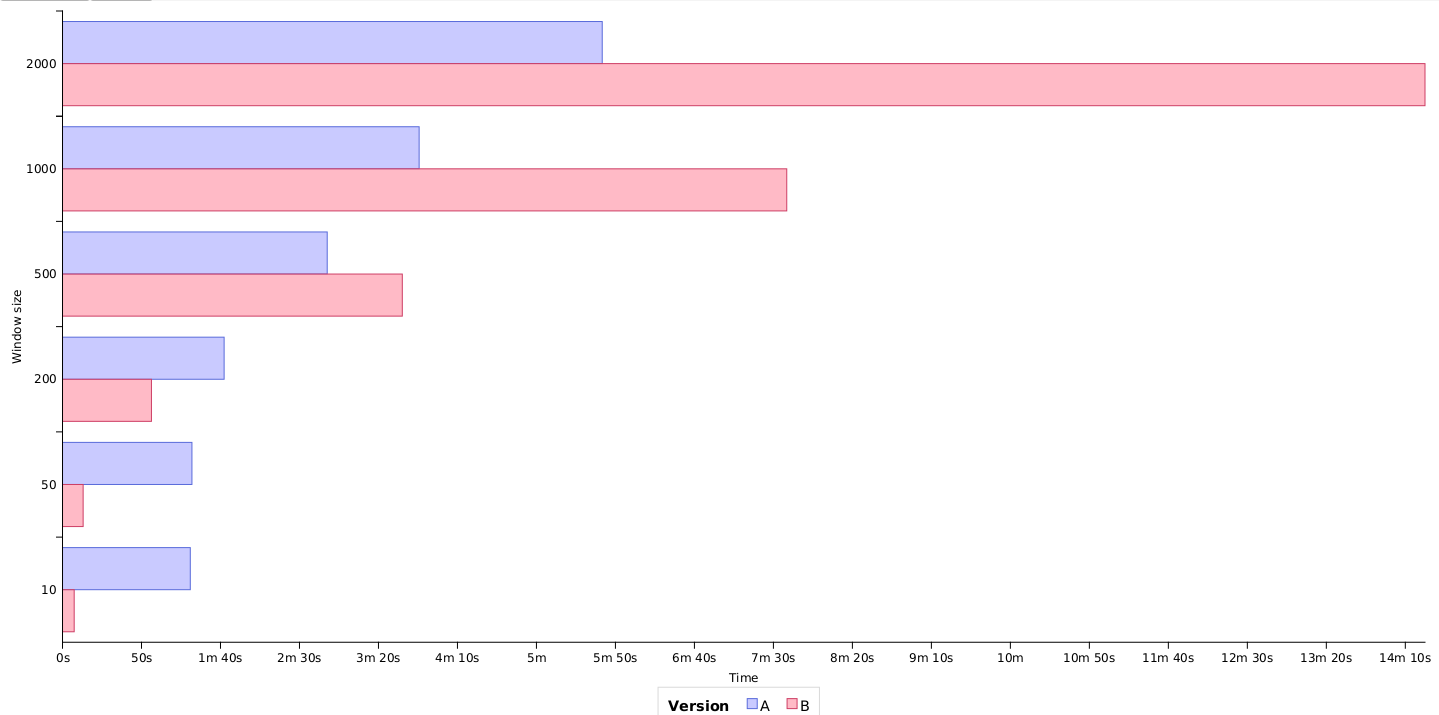
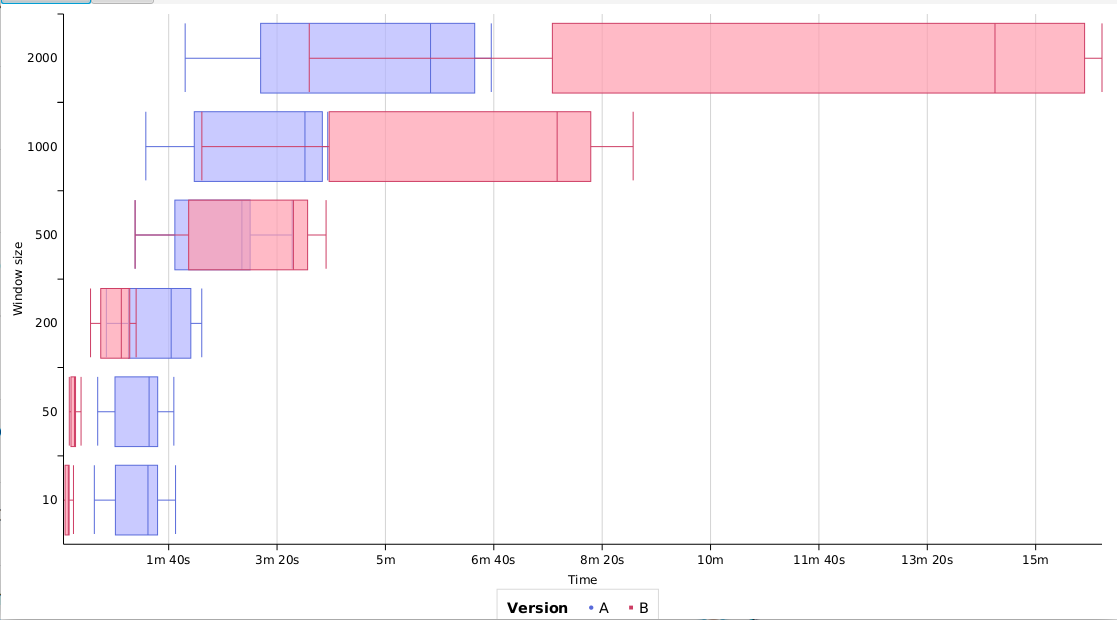
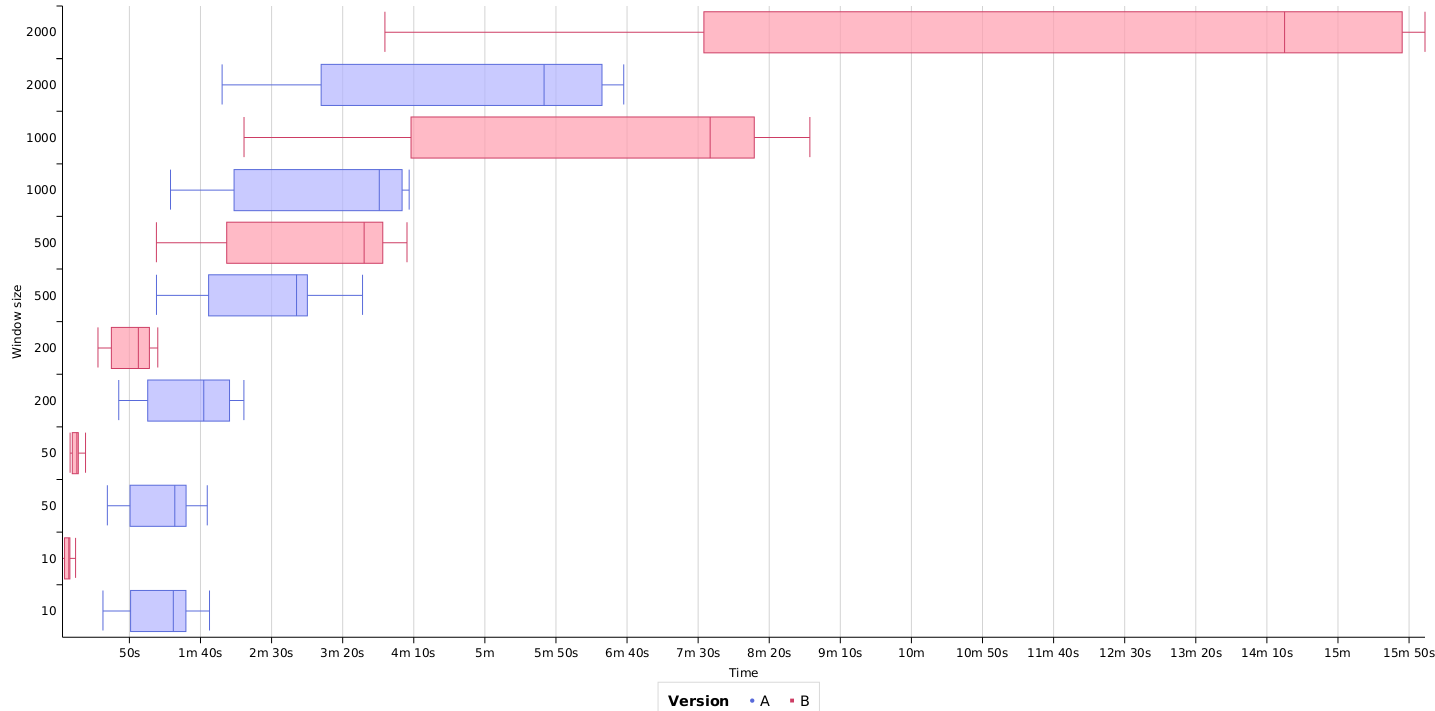
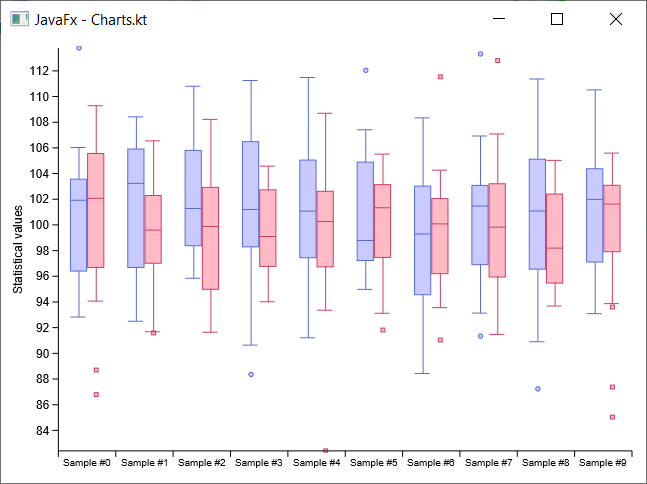
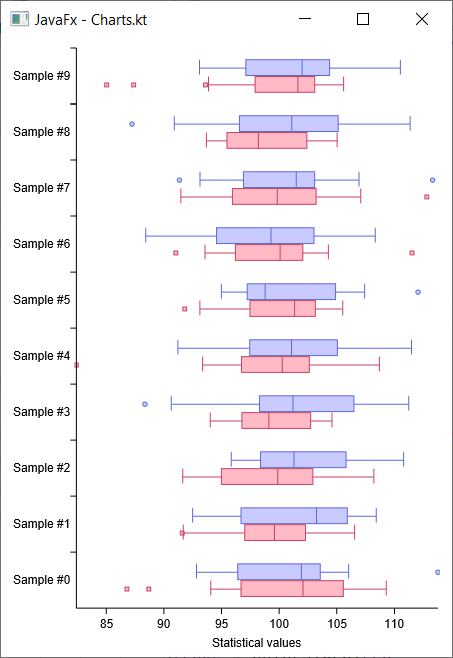
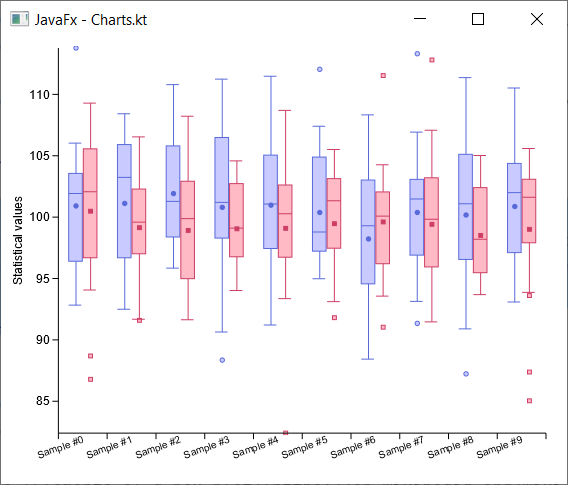
I cannot seem to make an account on that site, but I can drop all the code necessary to run in on that site right here. It’s based on the boxplot sample on play.data2viz, but a bit generalized to allow for grouping etc. It’s a bit messy, but it’ll provide something to work with for you. The wanted result is that the boxplots appear stacked next to each other within a group.
import io.data2viz.charts.*
import io.data2viz.charts.core.*
import io.data2viz.charts.core.Labelled
import io.data2viz.charts.dimension.*
import io.data2viz.charts.chart.*
import io.data2viz.charts.chart.mark.*
import io.data2viz.charts.viz.*
import io.data2viz.charts.layout.*
import io.data2viz.geom.*
import io.data2viz.color.*
import io.data2viz.random.RandomDistribution
import io.data2viz.timeFormat.*
import io.data2viz.timeFormat.TimeLocale
import io.data2viz.random.RandomGenerator
import kotlinx.datetime.*
import io.data2viz.math.*

// actual implementation

enum class Type {
    A, B, C
}

data class SomeResult(
    override val value: Double,
    val version: Int,
    val type: Type,
) : CanBecomeBoxPlotDataItem<SomeResultPlot> {
    companion object : CanBecomeBoxPlotDataItemDualGroupingCompanion<Int, Type, SomeResultPlot> {
        override fun toSpecificBoxPlotDataItem(item: BoxPlotDataItem<Int>, secondGrouping: Type): SomeResultPlot =
            SomeResultPlot(
                secondGrouping = secondGrouping,
                item = BoxPlotDataItemImpl(item),
            )
    }
}

data class SomeResultPlot(
    val secondGrouping: Type,
    val item: BoxPlotDataItemImpl<Int>,
) : BoxPlotDataItem<Int> by item

fun main() {

    val width = 850.0
	val height = 600.0

    val vc = newVizContainer().apply {
        size = Size(width, height)
    }

    val versions: List<Int> = listOf(1, 2, 3, 4, 5)
    val data: List<SomeResult> = versions.flatMap { version ->
        Type.values().flatMapIndexed { i, type ->
            ((i * 20)..(i * 20 + 50)).map { value ->
                SomeResult(
                    value = value.toDouble(),
                    version = version,
                    type = type,
                )
            }
        }
    }

    val plotResults: List<SomeResultPlot> = getBoxPlotResults(
        iterator = data.iterator(),
        firstGrouping = { it.version },
        secondGrouping = { it.type },
        toSpecificBoxPlotDataItem = SomeResult.Companion::toSpecificBoxPlotDataItem,
    )

    vc.chart(plotResults) {
        val versionDimension = discrete({ domain.groupingValue }) {
            name = "Version"
        }

        val typeDimension = discrete({ domain.secondGrouping }) {
            name = "Type"
        }

        val valueDimension = quantitative({ domain.median }) {
            name = "Value"
        }

        series = typeDimension

        boxPlot(versionDimension, valueDimension) {
            maximum = { domain.maximum }
            minimum = { domain.minimum }
            upperQuartile = { domain.upperQuartile }
            lowerQuartile = { domain.lowerQuartile }
            outliers = { domain.outliers }
        }
    }
}

// BoxPlotHelpers

interface CanBecomeBoxPlotDataItem<T : BoxPlotDataItem<*>> {
    val value: Double
}

interface CanBecomeBoxPlotDataItemDualGroupingCompanion<G1, G2, T : BoxPlotDataItem<G1>> {
    fun toSpecificBoxPlotDataItem(item: BoxPlotDataItem<G1>, secondGrouping: G2): T
}

interface CanBecomeBoxPlotDataItemCompanion<G1, T : BoxPlotDataItem<G1>> {
    fun toSpecificBoxPlotDataItem(item: BoxPlotDataItem<G1>): T
}

inline fun <reified T : BoxPlotDataItem<G1>, S : CanBecomeBoxPlotDataItem<T>, reified G1> getBoxPlotResults(
    iterator: Iterator<S>,
    noinline firstGrouping: (S) -> G1,
    noinline toSpecificBoxPlotDataItem: (boxPlotItem: BoxPlotDataItem<G1>) -> T,
): List<T> = getBoxPlotResults<T, S, G1, G1>(
    iterator = iterator,
    firstGrouping = firstGrouping,
    secondGrouping = firstGrouping,
    toSpecificBoxPlotDataItem = { boxPlotItem: BoxPlotDataItem<G1>, _: G1 ->
        toSpecificBoxPlotDataItem(boxPlotItem)
    },
)

inline fun <reified T : BoxPlotDataItem<G1>, S : CanBecomeBoxPlotDataItem<T>, reified G1, G2> getBoxPlotResults(
    iterator: Iterator<S>,
    noinline firstGrouping: (S) -> G1,
    noinline secondGrouping: (S) -> G2,
    noinline toSpecificBoxPlotDataItem: (boxPlotItem: BoxPlotDataItem<G1>, secondGrouping: G2) -> T,
): List<T> = iterator
    .asSequence()
    .groupBy(firstGrouping)
    .flatMap { (firstGroupingValue, it) ->
        it.groupBy(secondGrouping)
            .map { (secondGroupingValue, values) ->
                toSpecificBoxPlotDataItem(
                    getBoxPlotResults(firstGroupingValue, values),
                    secondGroupingValue,
                )
            }
    }
    .toList()


fun <S : CanBecomeBoxPlotDataItem<*>, G1> getBoxPlotResults(
    firstGroupingValue: G1,
    values: List<S>,
): BoxPlotDataItem<G1> {
    val orderedValues = values.sortedBy { it.value }.map { it.value }
    val median = median(orderedValues)
    val lowerQuartile = median(median.lowerList)
    val upperQuartile = median(median.upperList)
    val iqr = upperQuartile.medianValue - lowerQuartile.medianValue
    val outlierThreshold = iqr * 1.5
    val outlierThresholdMin = median.medianValue - outlierThreshold
    val outlierThresholdMax = median.medianValue + outlierThreshold
    val outliers = orderedValues.filter { it < outlierThresholdMin || it > outlierThresholdMax }
    val minimum = lowerQuartile.lowerList.firstOrNull { it >= outlierThresholdMin }
        ?: orderedValues.first { it >= outlierThresholdMin }
    val maximum = orderedValues.lastOrNull { it <= outlierThresholdMax }
        ?: upperQuartile.upperList.last { it <= outlierThresholdMax }
    val mean = orderedValues.sum() / orderedValues.size

    return BoxPlotDataItemImpl(
        groupingValue = firstGroupingValue,
        minimum = minimum,
        maximum = maximum,
        median = median.medianValue,
        lowerQuartile = lowerQuartile.medianValue,
        upperQuartile = upperQuartile.medianValue,
        mean = mean,
        outliers = outliers,
    )
}

interface BoxPlotDataItem<G1> {
    val groupingValue: G1
    val minimum: Double
    val maximum: Double
    val median: Double
    val lowerQuartile: Double
    val upperQuartile: Double
    val mean: Double
    val outliers: List<Double>
}

data class BoxPlotDataItemImpl<G1>(
    override val groupingValue: G1,
    override val minimum: Double,
    override val maximum: Double,
    override val median: Double,
    override val lowerQuartile: Double,
    override val upperQuartile: Double,
    override val mean: Double,
    override val outliers: List<Double>,
) : BoxPlotDataItem<G1> {

    constructor(other: BoxPlotDataItem<G1>) : this(
        groupingValue = other.groupingValue,
        minimum = other.minimum,
        maximum = other.maximum,
        median = other.median,
        lowerQuartile = other.lowerQuartile,
        upperQuartile = other.upperQuartile,
        mean = other.mean,
        outliers = other.outliers
    )
}

data class Median(
    val medianValue: Double,
    val lowerList: List<Double>,
    val upperList: List<Double>,
)

fun median(values: List<Double>): Median {
    val orderedValues = values.sorted()
    val vs = orderedValues.size
    val mid = vs / 2
    val median = if (vs % 2 == 1) orderedValues[mid] else (orderedValues[mid] + orderedValues[
            if (mid + 1 >= orderedValues.size) orderedValues.size - 1
            else mid + 1
    ]) / 2.0
    var listA = if (vs % 2 == 1) orderedValues.subList(0, mid) else orderedValues.subList(0, mid + 1)
    if (listA.isEmpty()) listA = listOf(orderedValues.first())

    var listB = orderedValues.subList(mid + 1, vs)
    if (listB.isEmpty()) listB = listOf(orderedValues.last())

    return Median(medianValue = median, lowerList = listA, upperList = listB)
}