Configuring Chart In Android Studio

I am using Android Studio to design my App. I am trying to configure parts of the chart:
strokeColor:

line(xDim, yDim){
                    strokeColor = Color.Black
                }

What format am I suppose to provide the color as this says that it is not data2viz.color?

Label, Zoom and Pan:

config {
                cursor {
                    show = true
                    type = CursorType.Crosshair
                }
                events {
                    triggerMode = TriggerMode.Column
                    zoomMode = ZoomMode.X
                    panMode = PanMode.X
                }
            }

I followed available examples but I was not able to zoom or pan in the app.

Marker:

line(xDim, yDim) {
                    strokeWidth = constant(3.0)
                    curve = MarkCurves.Curved
                    marker = constant(Symbols.Circle)
                    showMarkers = true
                }

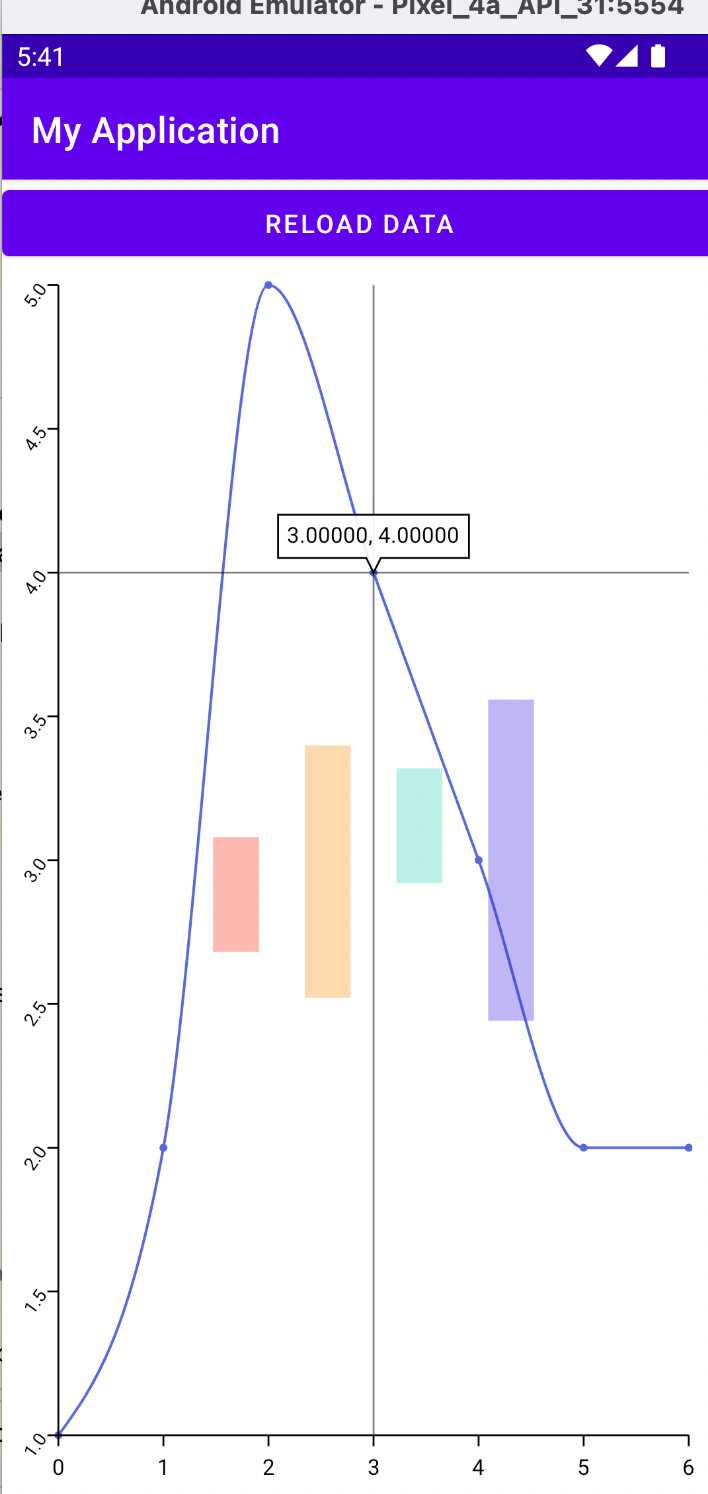
I have enabled to show marker in the above code but in the graph it does not show anything.

Here is an Image of the graph:
image

Has the licensing page broken or moved?

You can have a look here at how to use colors: https://play.data2viz.io/documentation/colors/

I don’t understand the problem.

This code

class ChartView(context: Context, data: List<Int>) : VizContainerView(context) {
	init {
		chart(data) {
			config {
				cursor {
					show = true
					type = CursorType.Crosshair
				}
				events {
					zoomMode = ZoomMode.XY
					panMode = PanMode.XY
				}
			}
			val xDimension = quantitative({ indexInData.toDouble() })
			val yDimension = quantitative({ domain.toDouble() })
			line(xDimension, yDimension){
				strokeWidth = constant(1.5)
				curve = MarkCurves.Curved
				marker = constant(Symbols.Circle)
				showMarkers = true
			}
		}
	}
}

produces

CleanShot 2022-01-18 at 17.41.24@2x

@gaetan
Thank you, and could please redirect me to the licensing page as I can’t seem to access it.

I have hover over each point and clicked on them but I am still not been able to observe the label/marker. Do I need to use .toDouble for the marker to show?
For context: I am redrawing the graph each time there is a button press

This my entire class:

class ChartView(context: Context, data: List, emp: Boolean) : VizContainerView(context) {

    init {
        chart(data){
            size = Size(vizSize, vizSize * SizeConstrain.height_h / SizeConstrain.width_w)
            title = "Random Number Gen"

            config {
                cursor {
                    show = true
                    type = CursorType.Crosshair
                }
                events {
                    //triggerMode = TriggerMode.Auto
                    zoomMode = ZoomMode.XY
                    panMode = PanMode.XY
                }
            }

            val xDim = discrete({ domain.time })
            val yDim = quantitative({ domain.rand }) {
                name = "Random Number (Out of Hundred)"
            }
            
            if (emp){
                empty(xDim, yDim)
            }else{
                line(xDim, yDim){
                    strokeWidth = constant(3.0)
                    //curve = MarkCurves.Curved
                    marker = constant(Symbols.Circle)
                    showMarkers = true
                    strokeColor = discrete({0x87ceeb.col})
                }
            }
        }
    }

    override fun onSizeChanged(w: Int, h: Int, oldw: Int, oldh: Int) {
        super.onSizeChanged(w, h, oldw, oldh)
        SizeConstrain.height_h = h.toDouble()
        SizeConstrain.width_w = w.toDouble()
    }

}

const val vizSize = 500.0

object SizeConstrain{
    var height_h = vizSize
    var width_w = vizSize

}

data class RanClass(val time: String, val rand: Double)

Please find it here Charts.kt licencing and get back to us if you have any inquiries or question.