Post here nice viz you found on the internet!
Information is beautiful 2019 winners

Post here nice viz you found on the internet!
Information is beautiful 2019 winners
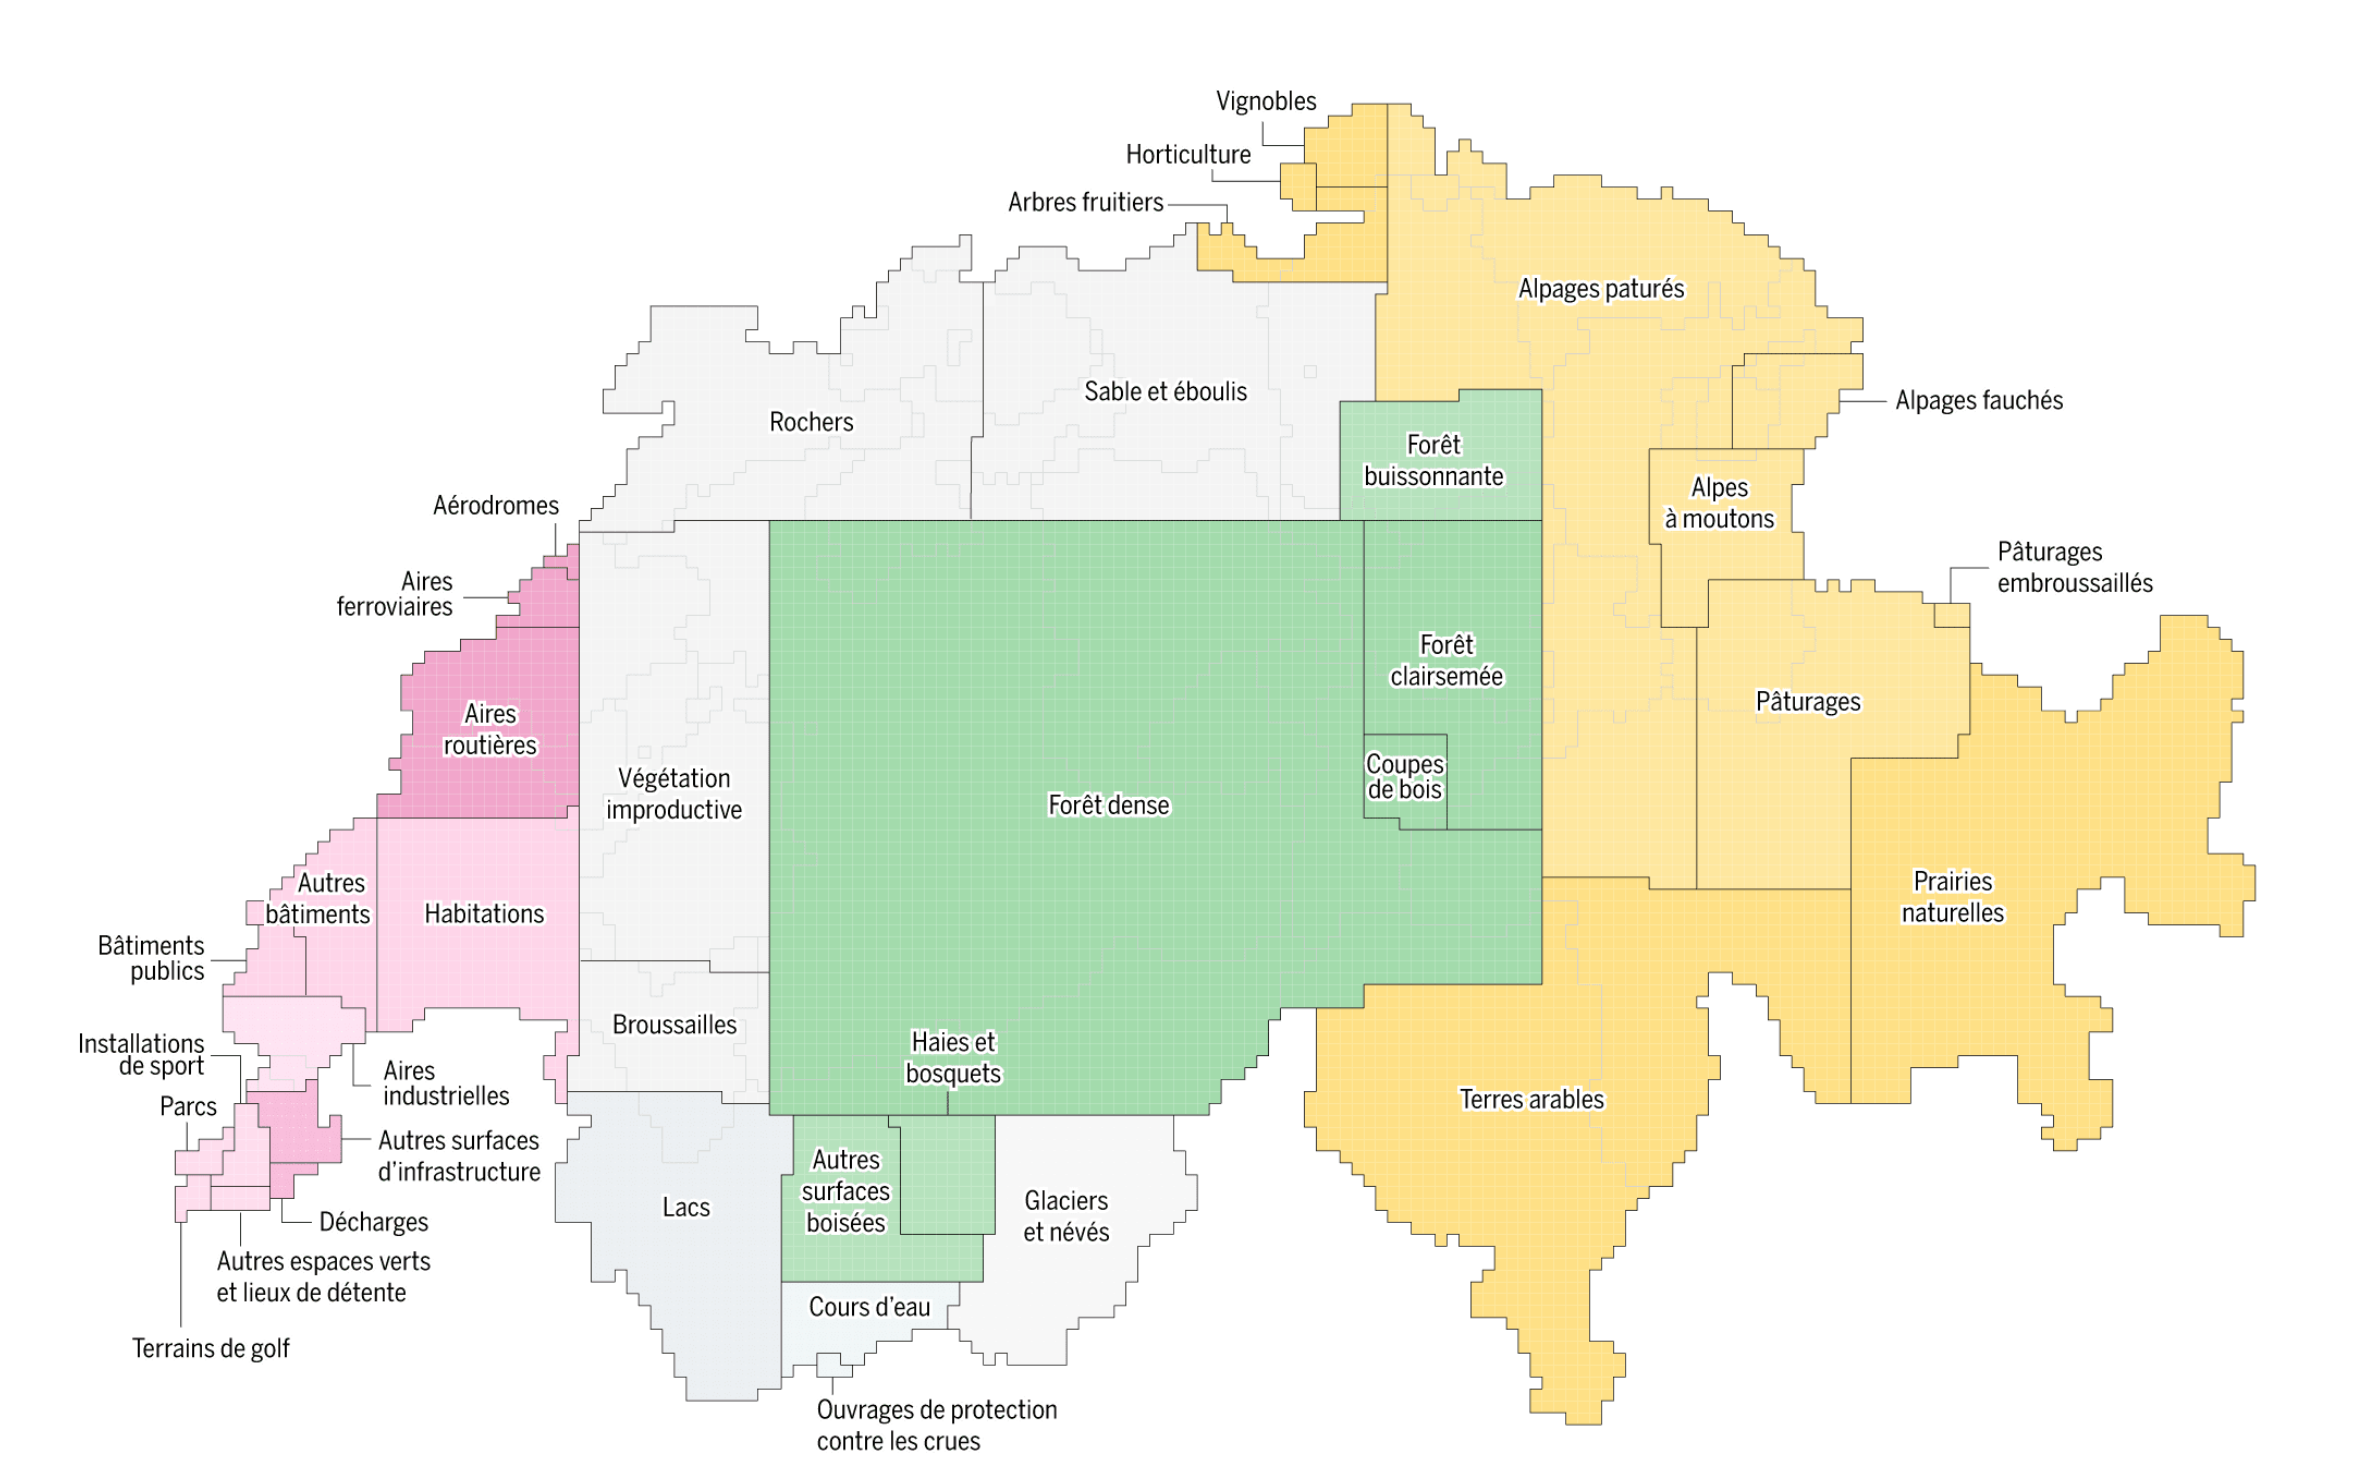
How does Switzerland divides its land (between urbanization, agriculture, forests…), inventive charts/maps:
This is an adaptation of the US version
“Animated Histogram”
“Animated Chord Diagram” when chord diagram is not enough 
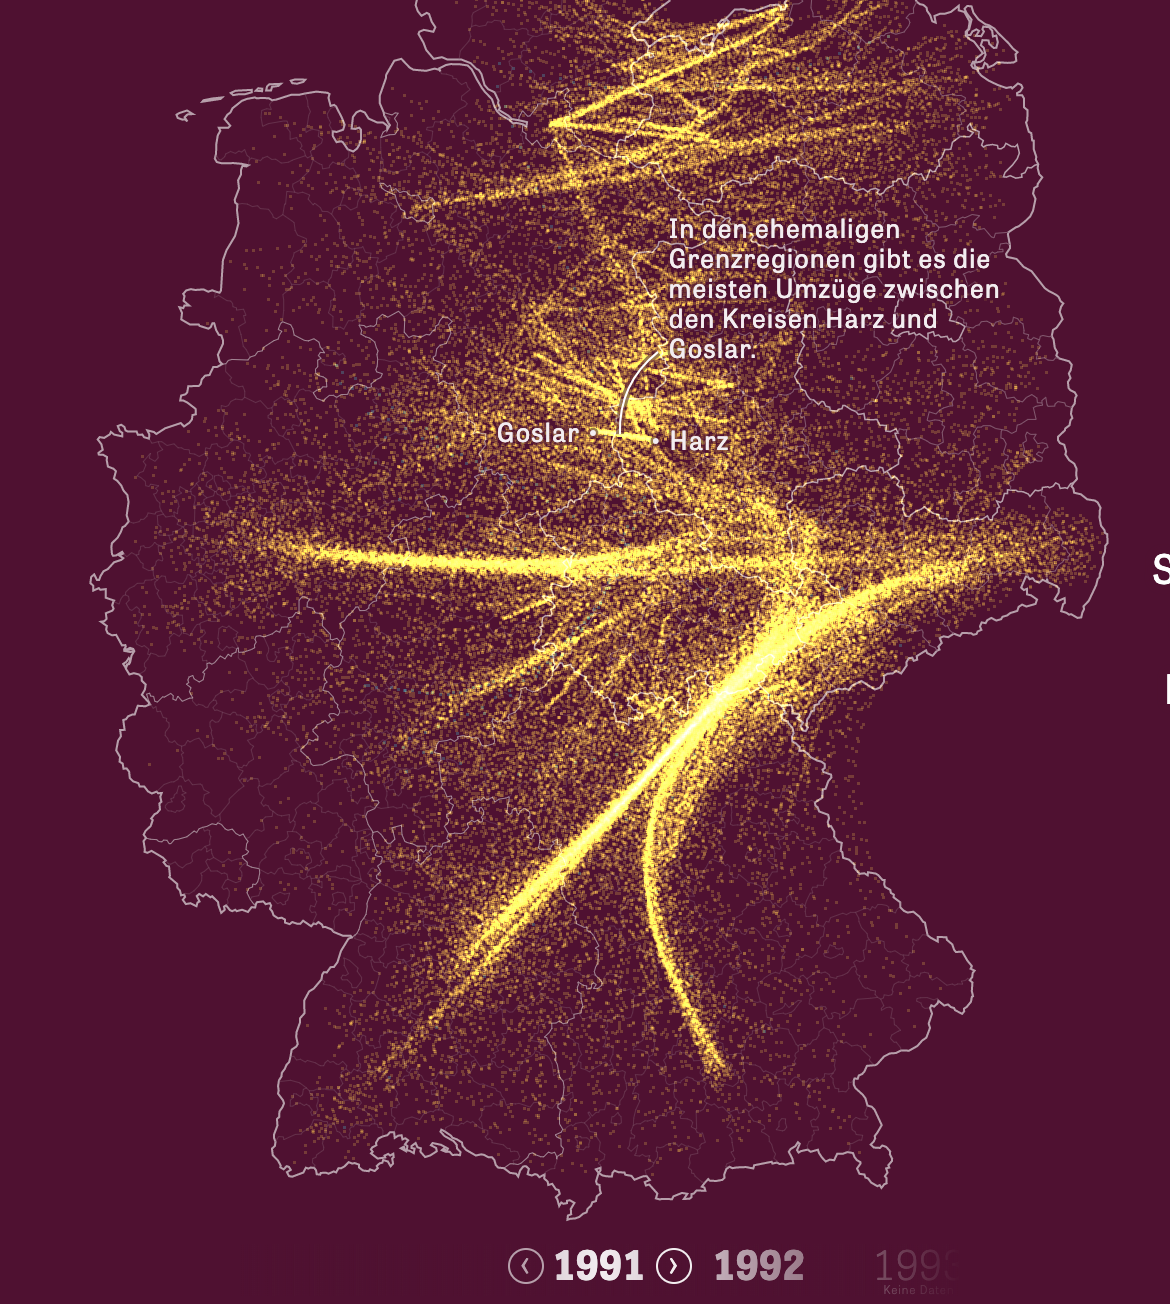
“Particle sankey” to emphasize on a terrible subject (this illustrates well the “when every item count”)
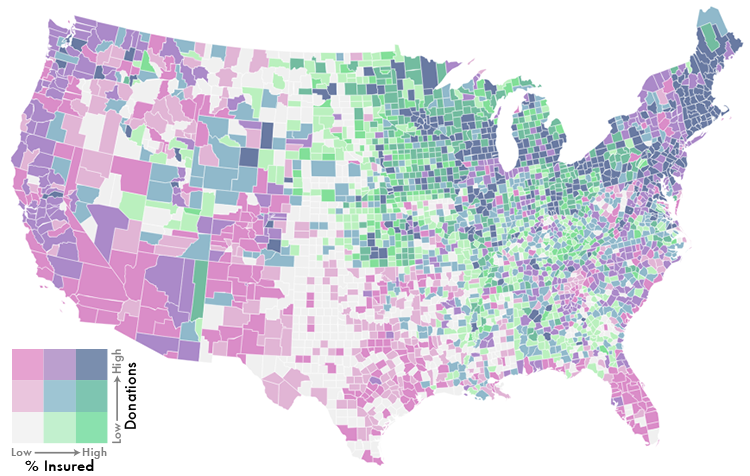
Bivariate Chloropeth maps
A barchart made of dots
Simple time laps visualisation.
Using archives to dig-up locations of air attacks on the North Sea from World War II.